
If you only have static content, you are losing attention and thus, reach and leverage, with every passing day. That’s where we introduce animated infographics, to bring a new and fresh look to the age old asset.
What Are Animated Infographics?

To summarize, animated infographics are your tried and true pie charts, and information booklets that have received a visual update, a better concept, and an animation dimension, to account and compensate for the ever shrinking ability of static imagery to draw attention and keep people reading.
Unlike your static infographics with charts, images, data, texts, their animated counterparts bring the visuals to life, making them easier to watch and digest.
And with all of those updated formats, like animated infographic video – the goal is delivery of information in a way that’s both engaging and memorable.
How Animated Infographics Differ from Animated Videos
Many marketers conflate animated infographics with standard animated videos, but the distinction matters when planning a campaign.
Animated videos are primarily narrative-driven. They tell a story with characters, voiceover, and a beginning-middle-end arc. The animation serves the story.
Animated infographics are data- and structure-driven. The animation serves the information — charts that build themselves, processes that reveal step by step, comparisons that appear side by side. The goal isn’t plot; it’s clarity.
This makes animated infographics the stronger choice when:
- Your message revolves around a process, a comparison, or a dataset
- Your audience needs to remember specific information, not just feel something
- You need to repurpose the same asset across multiple formats (a 90-second video, a looping GIF, a static thumbnail)
Knowing which format fits your goal saves you significant production time and keeps your message sharp.
Why Use Animated Infographics in Your Marketing?
1. Grab Attention
First and foremost, video should catch attention, and that’s its main use case. End of story. But as compared to complex 2D and 3D productions – animated infographics are more efficient, and have more streamlined costs.
They are easier to produce, but still include the animation factor that helps them combat static content and rise above.
If you are creating an infographics video, or interactive infographics for your website use cases – including extra touch of animation makes it that much more appealing and increases retention of information.
2. Simplify Complex Information
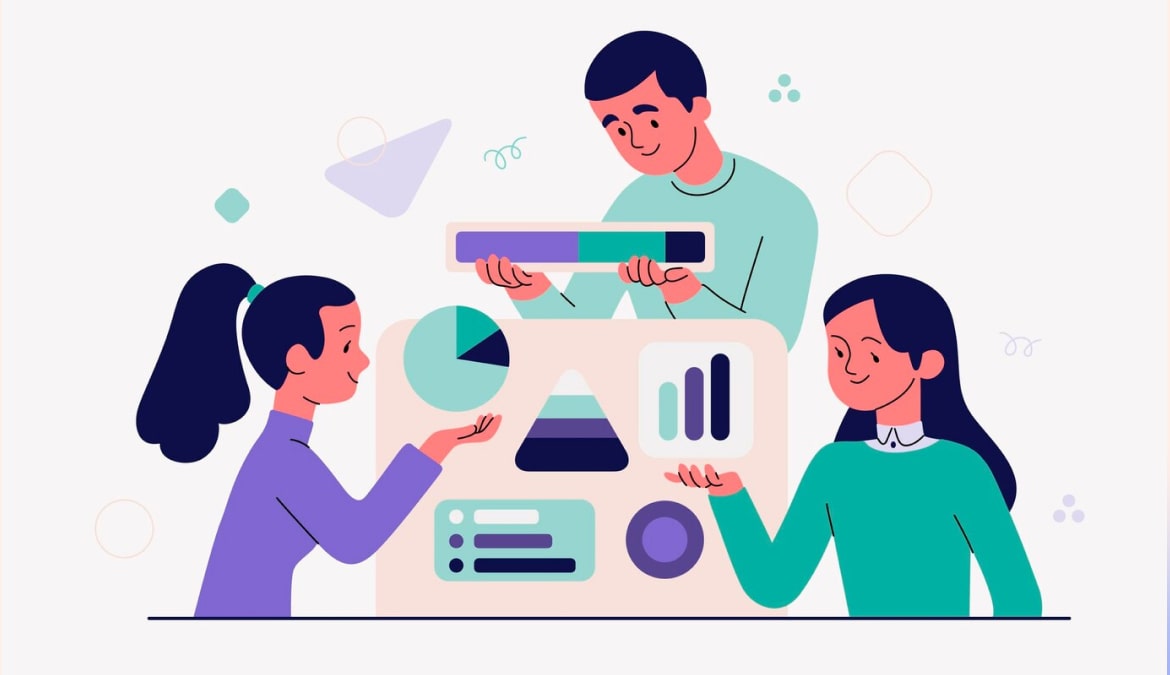
Another point why animated infographics are so good, is that they help to break down extremely complex and tedious concepts – and not in the same boring manner as static content usually does.
Usually, best animated infographics examples are those that are showing multi-step processes and showcasing data trends in a way that feels easy and convenient.
That’s the power of animation in place, helping the viewer to digest information in a more convenient way.
3. Increase Engagement and Retention
The numbers are in: people are more eager to digest and remember information if it was served to them in a convenient and highly visual way.
So when you have your numbers that can be quite tedious, and blend them with an engaging animation – you have a winning and powerful formula to make sure you achieve peak engagement.
This is how animated infographic videos keep your viewers glued to the content, and that your messaging stays with them for longer.
And if the content itself is valuable, it will also receive shares and virality, as people will be sharing it much more.
4. Encourage Interactivity
When creating interactive animated infographics, you can take engagement even further, by adding interactive elements which would allow your audience to engage with the content. Clicking to learn more, or quiz formats, are a great way to keep the flow of the video fresh and for viewers to feel that the content is actually customized for their diverse needs.
How to Choose the Right Style of Animated Infographic for Your Goal
How to Choose the Right Style of Animated Infographic for Your Goal
Not all animated infographics serve the same purpose — and choosing the wrong style for your goal is the most common production mistake we see.
Here’s a practical decision framework based on what we’ve seen work across 200+ campaigns:
- Kinetic typography infographics work best when your message is quote-driven or when you’re distilling a longer report into a shareable social asset. The movement guides the eye through key statements without needing complex illustration.
- Animated chart/data infographics are the right call when your content is comparison-heavy — pricing tiers, market breakdowns, before/after results. Watching a bar chart build to its final number is inherently more engaging than reading it.
- Process/flow infographics shine when you’re walking a user through a multi-step system — an onboarding workflow, a compliance framework, a supply chain. Each step appearing in sequence gives the viewer time to absorb before moving on.
- Interactive infographics are worth the extra investment specifically for high-intent website pages where you want visitors to self-segment — clicking through to the data that applies to them extends time-on-page and generates more qualified leads.
How to Use Animated Infographics in Your Marketing
Boost Your Social Media Presence
Social media, especially places like LinkedIn for those of us within B2B, is arguably the best place for visual content and specifically animated infographic videos. Even more so, other social media with its unfair pivot towards videos, would also be a good place to share your animated content.
Even if you have a 5-10 minute video, you can cut it down into 15, 30, 45, and even 60 second videos and share across platforms like Instagram, TikTok or Facebook, as those platforms are more receptive to shorter form content. This compact format of animated infographic video helps with grabbing attention and improving your overall reach.
Enhance Your Website with Interactive Elements
Your website will benefit from interactive animated Infographics – as the more time people spend watching animated infographics and interactive content, the better your website ratings become, and this way, your SEO gets improved as well.
If you have a SaaS, AI, or other B2B product – the more time a prospect spends on your website and interacting with your content, the easier the sales cycle is going to be for your sales team further down the line.
You’ll get more qualified leads that are more eager to learn more.
Most likely, if you only had PDFs, plain texts and articles – that information has been quickly skimmed in many cases, without it being given a second thought.
Incorporate Animated Infographics in E-Learning
One of the most powerful use cases when it comes to online education is animated infographics for e-learning. We’ve already discussed many times how visual and engaging content is always better for retention, and the biggest winners would be in corporate training, online courses and such.
This makes learning go from a dull affair, to an easier learning, especially if your more complex topics or procedures lean heavily into animation.
Here’s our great example of a great e-learning video on GDPR, that we have produced for Elementor.
Make Your Email Campaigns Stand Out
Listen – inboxes are dying from Chat GPT generated content, which are almost entirely text based.
So if you are looking for people to actually engage with your content, rethink how you share your information, even in a traditionally text oriented format like email.
Key statistics, software product features or even your newest promotional offer can be updated with an animated visual, guaranteeing higher conversion rates.
Examples of Animated Infographics in Action
So, let’s see some of the examples of animated infographics, that you can use to significantly improve how you deliver data and insights:
Animated infographics. These are regularly used to explain your product integrations, or results of how the output will become better once the solution is implemented in a meaningful way.
Data Visualizations. For this type, they are often combined with clickable and interactive elements, to make sure that users can learn their own way, in a build your own adventure style of exploration, making it much more memorable, and convenient.
Geographic Animated Infographics. These examples normally include the full focus on animated maps, charts and other elements that showcase geographical elements, and show data connected to various locations. This is usually used to show differences between market stats, and so on.
Process Explainer Animated Infographics. These ones focus on showing workflows, detailed instructions and step by step procedures. This can also be used to portray decision making processes.
Matching Format to Platform:
Each distribution channel has different constraints, so a single animated infographic rarely performs equally well across all of them without adaptation.
- For example, LinkedIn favors square or vertical formats (1:1 or 4:5) with subtitles burned in.
- Decision-makers scroll quickly, so your infographic must communicate its main point within the first three seconds, even without sound. Process and data chart formats tend to perform better here.
- Instagram and TikTok reward vertical (9:16) videos and speed. Shorter videos, between 15 and 30 seconds, with bold color palettes and kinetic movement, perform best. If your original infographic video is 90 seconds long, create a shorter version specifically for these platforms instead of simply reformatting it.
- Longer, interactive formats belong on your website. For example, a 90-second animated walkthrough on a landing page can support purchase decisions. An interactive infographic embedded in a blog post increases average session duration, which is a behavioral signal that correlates with ranking performance.
- Although email is the least obvious placement, embedding an animated GIF of a key chart or process from your infographic gives your campaigns a visual anchor that plain text can’t match.
Here at Zelios, our team can help with high quality animated infographics video production services so reach out and let’s talk!
Select the video type that aligns with your marketing objectives, and receive an immediate high-level estimate of the production cost.